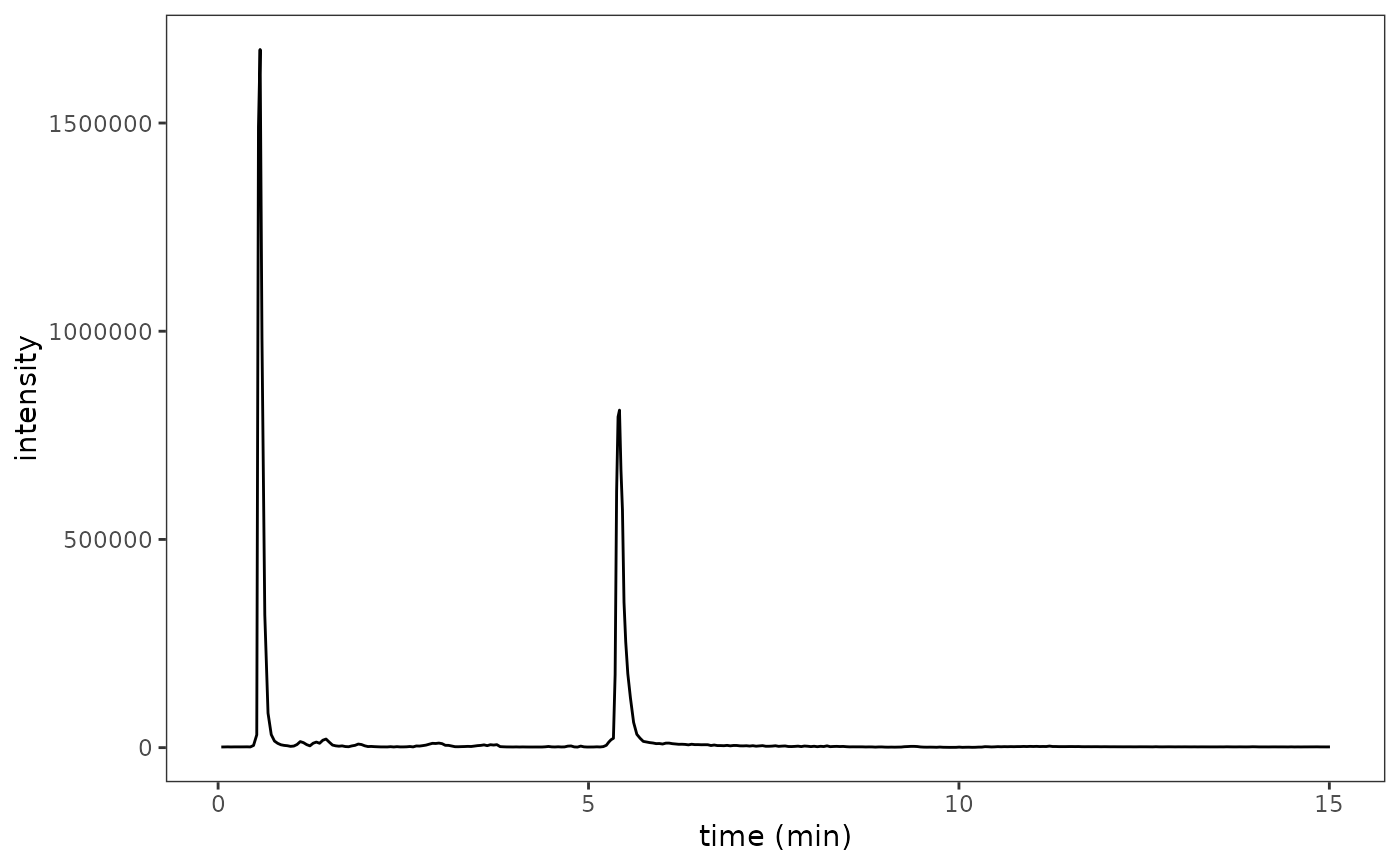
Plot the total ion current.
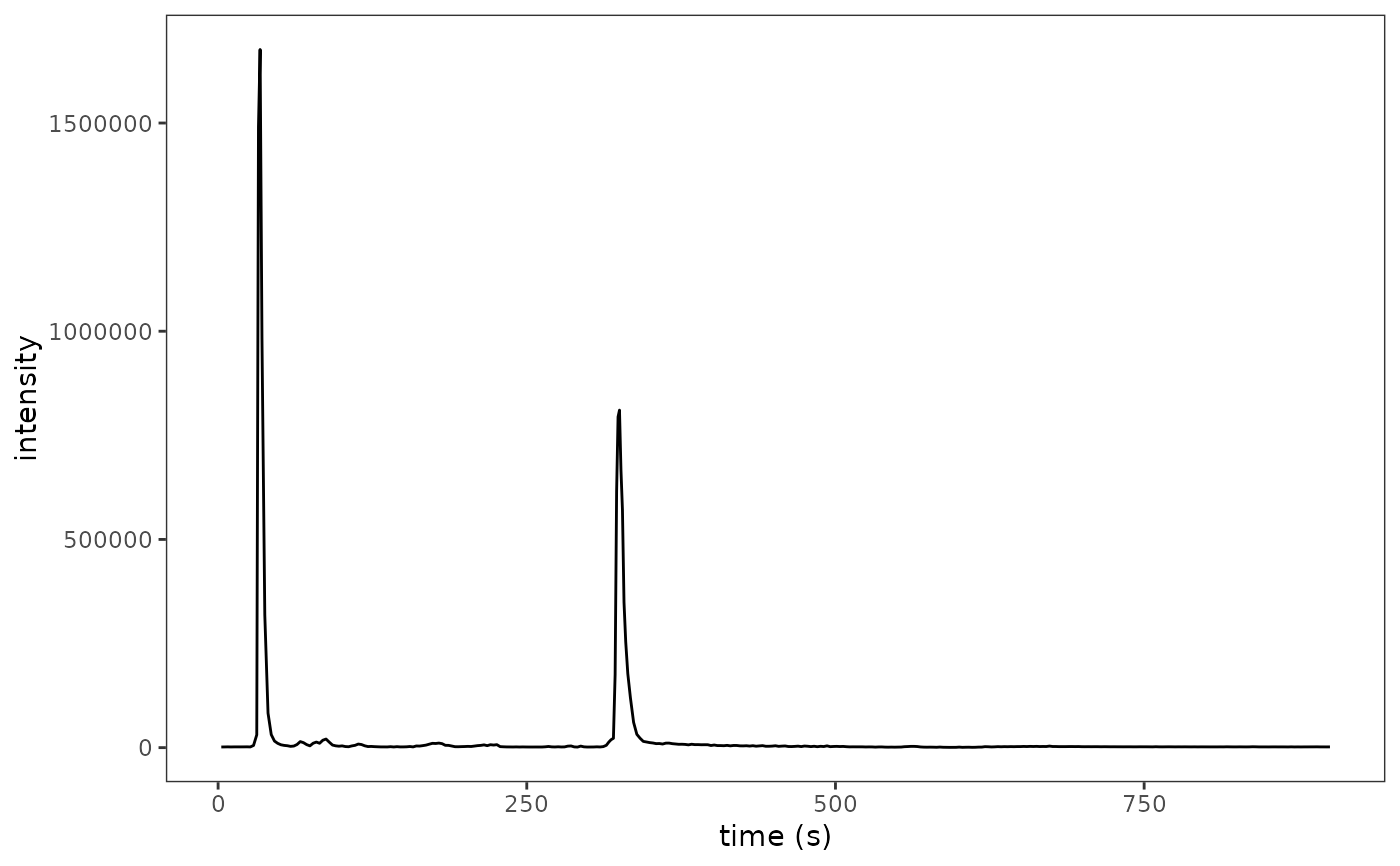
plot_tic(ms_data, time_scale = c("min", "s"), filter_ms1 = TRUE)
Arguments
| ms_data | Mass spectrometry data stored in an mzR object as returned by
|
|---|---|
| time_scale | Units used for the x-axis. |
| filter_ms1 | If true, only scans from MS level 1 are taken into account. |
Value
A ggplot object describing the created plot.
Examples
ms_data <- mzR::openMSfile( system.file("extdata", "mzml", "mab1.mzML", package = "fragquaxi") ) plot_tic(ms_data)plot_tic(ms_data, time_scale = "s")