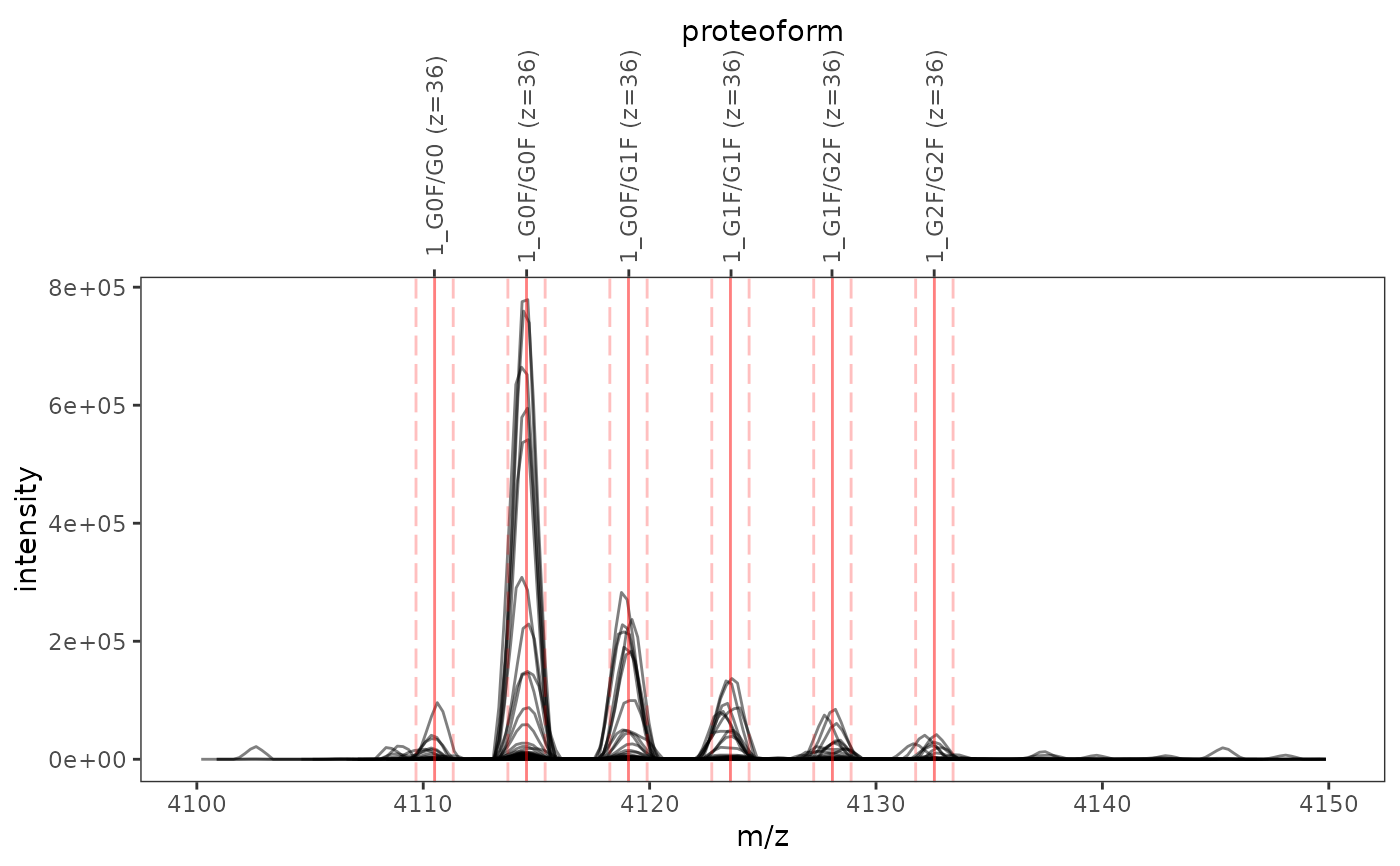
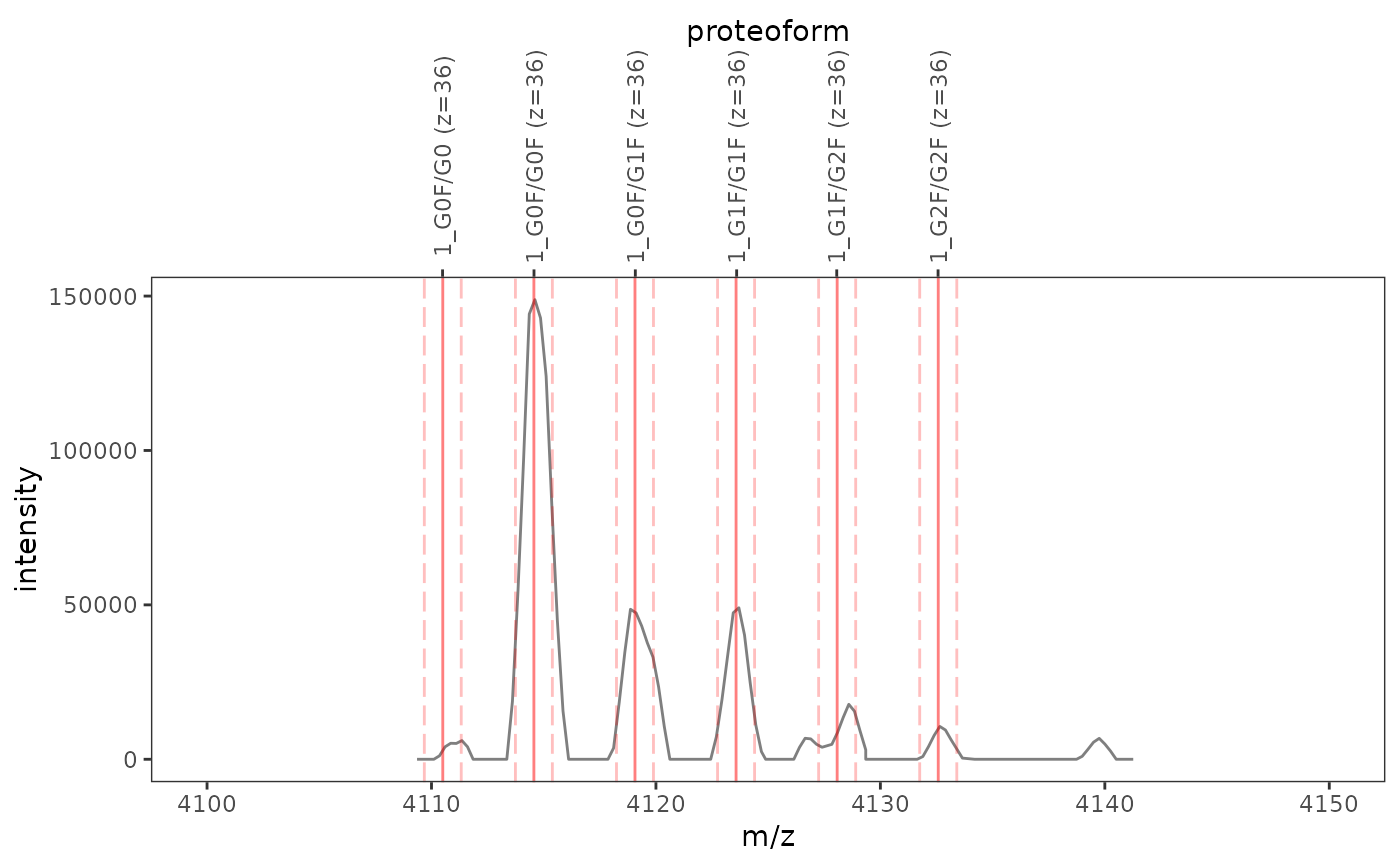
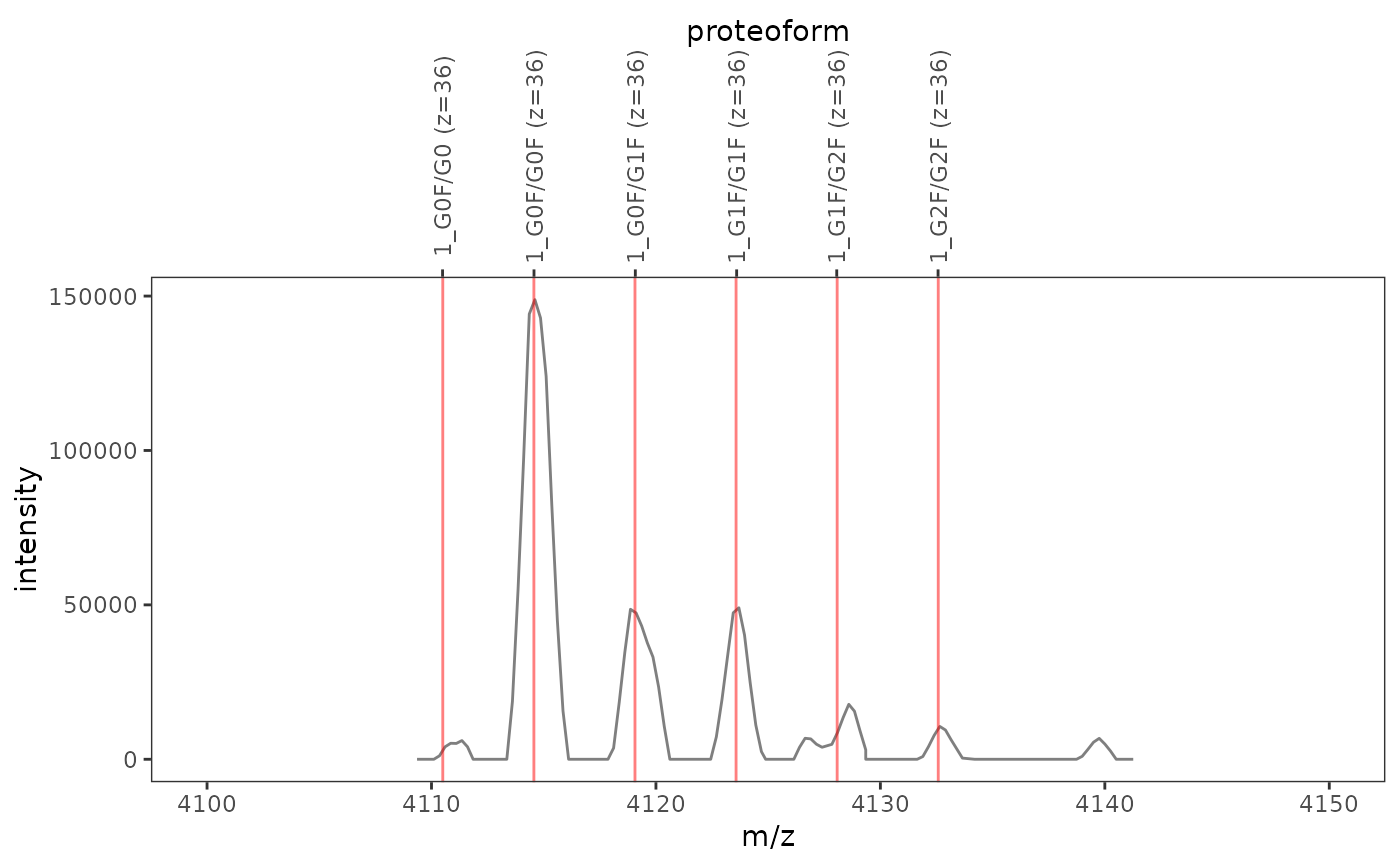
This function plots one or several mass spectra overlaid with mass-to-charge ratios and integration boundaries of proteoform ions.
plot_ions(
  ms_data,
  ions,
  scans = NULL,
  rt_limits = NULL,
  xlim = NULL,
  plot_elements = c("mz", "mz_min", "mz_max", "ion_labels"),
  filter_ms1 = TRUE
)
Arguments
| ms_data | Mass spectrometry data stored in an mzR object as returned by
|
|---|---|
| ions | A data frame describing mass-to-charge ratios of proteoform ions
as returned by |
| scans | Scan numbers to show (vector of integers). If |
| rt_limits | A numeric vector with two elements specifying retention time
limits (in seconds) for selecting scans. If values are specified for both
|
| xlim | x-axis limits, given as |
| plot_elements | Character vector specifying which plot elements should be displayed:
|
| filter_ms1 | If true, only scans from MS level 1 are selected by the retention time limits. |
Value
A ggplot object describing the created plot.
Examples
ms_data <- mzR::openMSfile( system.file("extdata", "mzml", "mab1.mzML", package = "fragquaxi") ) proteins <- define_proteins( system.file("extdata", "mab_sequence.fasta", package = "fragquaxi"), .disulfides = 16 ) modcoms <- define_ptm_compositions(sample_modcoms) pfm_ions <- assemble_proteoforms(proteins, modcoms) %>% ionize(36L) # show all scans plot_ions(ms_data, pfm_ions, xlim = c(4100, 4150))# only show selected plot elements plot_ions(ms_data, pfm_ions, scans = 126, xlim = c(4100, 4150), plot_elements = c("mz", "ion_labels"))